Park City Real Estate Trends and Market Update for 2022 (Historical Data)
Let's dig into the market trends for 2022. First, we will review what a typical buyer considers a Park City property and Snyderville Basin. Homes currently for sale in these areas of Park City can be found on our Park City Neighborhoods page. For a general discussion, we could begin to feel the market slow as interest rates increased. Buyers were pulling back, and sellers receiving up to ten offers were only receiving one or two.
The statistics below won't show the full story of the real estate market in Park City. Until the fall, inventory was significantly depleted, and well-priced homes sold well throughout the year. By year's end, we could find properties for clients, but with the talk of a recession, buyers wanted the perfect property with a five percent discount off the listing price. As a result, at the time of this update, only eight genuine ski-in-ski-out homes are still for sale in Park City.
Park City Single Family Home Review for 2022:
The median sales price for a single-family home in Park City increased by 11.9% in 2022 to $2,700,000, and the price per square foot increased by 17.9% to $746. However, due to a lack of inventory for the first part of the year, home sales were down 41.1% to 400 homes sold.
2022 Park City Condominium and Townhome Market Evaluation:
The median sales price for a Park City condo or townhome increased by 40.5% in 2022 to $1,205,000, and the price per square foot increased by 34.7%. However, sales were down 26.1% to 774 homes sold. Although condo sales significantly dropped, 241 were new construction, mainly in Deer Valley and Canyons Village.
As of January 2023, we don't have many new construction options to sell buyers, but there are some off-market options if you'd like to discuss the best new condo options in the Park City area.
The Number of Properties for Real Estate in Park City - January 2023
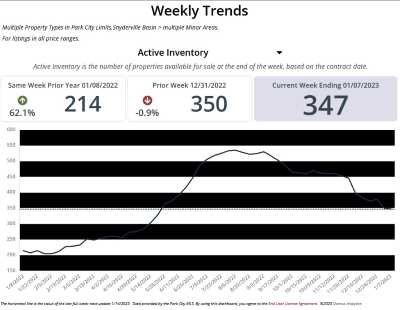 As you can see in the graph to the right, the number of homes, condos, and townhomes for sale in Park City climbed over the summer, reaching around 525 listings. However, inventory has fallen and returned to 347 properties.
Our website has every home from every broker for sale at Deer Valle Resort and Park City, Utah. We are aware of some off-market resort properties.
Park City property had ten closed sales and nine new listings in Park City proper with about a six-month supply of homes. Even with interest rates climbing, statistics show a balanced market for single-family homes. The days on the market have eased to 37, but that's still historically fast.
PLEASE NOTE: While other statistics look at the entire Park Cty MLS, for this review, we only look at homes and condos for sale in Park City, Utah - zip codes 84060 and 84098.
To ensure a seamless browsing experience, we have archived our past reports. Check out our Park City Market Trends for 2020 to Current.
- Current Park City Market Trends
- 2024 Market Stats for Park City, Utah
- 2023 Park City Market Stats
- 2021 Park City Market Report
- 2020 Park City Real Estate Trends
Year Review for 2022 for Sold Properties by Price Range
As you'll see below, every price range fell for the number of properties sold in Park City.
Why is the number of real estate sales dropping in Park City? We've discussed that inventory was limited, and the listings had fallen back to the levels we were at in May by December.
I always go back to supply and demand. We all understand that demand has fallen, but pre-covid, it was typical to have 1200 listings for sale in Park City. At the bottom of this page, you'll see that when I started the MLS Statistics writeup listings, there were 1,225 (Total Active Residential Listings in Park City = 1,225 as of 6/19/2020).
Over the past few years, we have built hundreds of homes and condos, so you would expect to see more listings on the market than there are currently. While inventory and the number of sales may be dropping, we wouldn't expect to see sky-falling type prices in Park City until we are well over 1,200 homes and condos for sale on the Park City MLS.
| Sold Listings by Price Range - 22' vs. 21' | |||
| 2022 vs. 2021 | |||
| 2022 | 2021 | % Chg | |
| 300,000-399,999 | 47 | 181 | -74 |
| 400,000-499,999 | 106 | 198 | -46.5 |
| 500,000-599,999 | 107 | 188 | -43.1 |
| 600,000-699,999 | 99 | 193 | -48.7 |
| 700,000-799,999 | 135 | 244 | -44.7 |
| 800,000-899,999 | 142 | 199 | -28.6 |
| 900,000-999,999 | 144 | 166 | -13.3 |
| 1,000,000-1,499,999 | 476 | 482 | -1.2 |
| 1,500,000-1,999,999 | 281 | 304 | -7.6 |
| 2,000,000-2,499,999 | 117 | 146 | -19.9 |
| 2,500,000-2,999,999 | 114 | 143 | -20.3 |
| 3,000,000-3,999,999 | 144 | 201 | -28.4 |
| 4,000,000-4,999,999 | 89 | 10 | -14.4 |
| 5,000,000+ | 101 | 145 | -30.3 |
| Totals | 2,117 | 2,966 | -28.6% |
Review of My 2022 Prediction
Below is the information I wrote reviewing what I thought would happen in 2022. I thought it would be fun to look back and see where I was right and where I was wrong:
Home prices only increased by about half of what I predicted on the low side, possibly due to statistically skewed data. The condo's prediction was spot on for the high appreciation side. Again, most likely, that's because of skewed data and some of the new construction projects closing at Canyons Valley and Deer Valley.
Going into 2023, I still believe we are down to people who want to be here, and we have sellers that have a great interest rate they don't want to lose, or if they sell with a profit, they don't know where else to put their money for the return they believe they will receive in the future.
Park City Real Estate Forecast for 2022
Coming out of the 2020 COVID lockdowns, buyers had their choice of what they wanted in a home if they decided to write an offer quickly. Unfortunately, 2021 was a race to the end to purchase the remaining properties with a bit of craziness in the market. Many winning buyers have been offering cash with a quick close and releasing earnest money upon mutual acceptance of the contract – speed and being aggressive have been the keys to winning multiple offers.
What will 2022 bring down the Park City real estate market? We are past the peak of the market's craziness, but the demand is still extremely high, while inventory will remain low. Basic economics will tell you that prices continue to increase.
We are boiled down to people who love the Park City lifestyle and don't want to sell unless there's a significant life change. Many previous buyers wouldn't sell if you offered double their purchase price. The utility and enjoyment are too great to sell for a profit, and they'll need to pay more taxes.
I've told clients that Park City real estate has a huge upside when looking at Aspen and Jackson Hole for years. Our prices ran at 50% of other luxury ski towns that aren't convenient, but we've broken away from a half-price market. As a result, Park City is trying to find a new equilibrium for pricing. Barring any catastrophe, I expect pricing to settle 20% to 40% higher than today's pricing.
Historical Information - Park City Market Summary 2022
Below are Park City real estate trends before the full 2022 review. When I started this post, the plan was to keep it updated every month with what was going on with real estate in Park City and Deer Valley. Still, the market became so hectic; at one point, having 27 properties under contract, there are some gaps in months, but it is the complete market update for Real Estate Trends in Park City, Utah, that you'll find.
We may reflect on how we listened to the Wind of Change in six months. Have the higher interest rates finally caught up to the real estate market in Park City, Utah? Relative to major cities with similar price ranges, we have a small, unique market - you could say boutique market that is different in many ways. Unfortunately, Park City doesn't have enough real estate transactions to be confident about what's going on in the market. Like when the market was screaming up when we were getting out of lockdowns - we won't know the details for a few months.
I like to keep things simple - my tell-tale gauge of the market is when inventory goes up, and the number of transactions goes down; in theory, prices will soon follow the number of transactions. Historically, real estate in Park City sells at 95% of the list price to sales price - I believe we'll need to hit that first before the market is noted as a downturn. On the other hand, buyers and sellers may be so used to 100% of the asking price that sellers lower the list price to strike.
Have you seen the recently published article from Time Magazine placing Park City as one of the World's 50 Greatest Places of 2022? Park City, Utah: A "year-round playground," according to TIME, this ski town, which made its name hosting the Sundance Film Festival, is now "enticing summer visitors with golfing, hiking, fly-fishing, and mountain-biking opportunities."
Overall, we can speculate on what will happen with the market, but most of us believe Park City sits in a beautiful spot long-term. It's a mountain town that can't be beaten for making memories. I've always said Park City is about Living Life on Vacation, not an investment town.
About the number of listings for May - June 2022:
About the Listing Price
About the Absorption Rate
- The number of active listings
- The average number of listings sold per month for the previous n months.
The number of active listings is a "snapshot" of listings active on a single day (the 15th of the month). However, the number of actives is not static and depends on when the report is run. For example, the number of months of sold listings here is 12.
The formula is Absorption Ratio = A ÷ NWhere A = listings active on the 15th of the month, and
N = the average number of listings sold during the previous 12 months.
Comment at the bottom of this page if you have any thoughts.
| Statistics for Park City Real Estate in June 2022 | ||||||
| Jun-22 | Jun-21 | % Chg | 2022 YTD | 2021 YTD | % Chg | |
| Absorption Rate | 2.93 | 1.75 | 67.43 | 1.7 | 1.94 | -12.37 |
| Average List Price | $2,839,047 | $2,806,606 | 1.16 | $2,429,369 | $2,118,965 | 14.65 |
| Median List Price | $1,612,500 | $1,297,000 | 24.33 | $1,450,000 | $1,199,100 | 20.92 |
| Average Sale Price | $1,784,547 | $1,663,404 | 7.28 | $1,839,961 | $1,662,014 | 10.71 |
| Median Sale Price | $1,175,000 | $999,500 | 17.56 | $1,275,000 | $981,190 | 29.94 |
| Average CDOM | 29 | 65 | -55.38 | 43 | 80 | -46.25 |
| Median CDOM | 6 | 6 | 0.00 | 5 | 10 | -50.00 |
| Sold Listings in June 2022 | ||||||
| This Month | Year to Date (2022) | |||||
| 2022 | 2021 | % Chg | 2022 | 2021 | % Chg | |
| 0-199,999 | 0 | 2 | -100.0 | 1 | 12 | -91.7 |
| 200,000-249,999 | 0 | 4 | -100.0 | 1 | 14 | -92.9 |
| 250,000-299,999 | 0 | 6 | -100.0 | 4 | 18 | -77.8 |
| 300,000-399,999 | 1 | 17 | -94.1 | 26 | 92 | -71.7 |
| 400,000-499,999 | 5 | 20 | -75.0 | 61 | 98 | -37.8 |
| 500,000-599,999 | 7 | 8 | -12.5 | 56 | 95 | -41.1 |
| 600,000-699,999 | 7 | 17 | -58.8 | 50 | 93 | -46.2 |
| 700,000-799,999 | 8 | 36 | -77.8 | 68 | 128 | -46.9 |
| 800,000-899,999 | 12 | 17 | -29.4 | 84 | 87 | -3.4 |
| 900,000-999,999 | 19 | 12 | 58.3 | 80 | 86 | -7.0 |
| 1,000,000-1,499,999 | 59 | 47 | 25.5 | 283 | 201 | 40.8 |
| 1,500,000-1,999,999 | 26 | 23 | 13.0 | 171 | 131 | 30.5 |
| 2,000,000-2,499,999 | 9 | 14 | -35.7 | 61 | 69 | -11.6 |
| 2,500,000-2,999,999 | 9 | 11 | -18.2 | 67 | 74 | -9.5 |
| 3,000,000-3,999,999 | 12 | 17 | -29.4 | 84 | 99 | -15.2 |
| 4,000,000-4,999,999 | 7 | 12 | -41.7 | 44 | 52 | -15.4 |
| 5,000,000+ | 10 | 15 | -33.3 | 61 | 65 | -6.2 |
| Totals | 191 | 278 | -31.3 | 1202 | 1414 | -15.0 |
| Pending Listings in Park City, Utah | Also known as in escrow or under contract | ||||||
| This Month | Year to Date | |||||
| 2022 | 2021 | % Chg | 2022 | 2021 | % Chg | |
| 0-199,999 | 0 | 4 | -100.0 | 0 | 12 | -100.0 |
| 200,000-249,999 | 0 | 0 | 0.0 | 2 | 9 | -77.8 |
| 250,000-299,999 | 0 | 6 | -100.0 | 2 | 15 | -86.7 |
| 300,000-399,999 | 2 | 13 | -84.6 | 20 | 89 | -77.5 |
| 400,000-499,999 | 8 | 29 | -72.4 | 54 | 118 | -54.2 |
| 500,000-599,999 | 9 | 15 | -40.0 | 52 | 107 | -51.4 |
| 600,000-699,999 | 9 | 21 | -57.1 | 44 | 100 | -56.0 |
| 700,000-799,999 | 5 | 21 | -76.2 | 46 | 151 | -69.5 |
| 800,000-899,999 | 9 | 14 | -35.7 | 65 | 115 | -43.5 |
| 900,000-999,999 | 8 | 14 | -42.9 | 54 | 96 | -43.7 |
| 1,000,000-1,499,999 | 41 | 41 | 0.0 | 280 | 245 | 14.3 |
| 1,500,000-1,999,999 | 27 | 32 | -15.6 | 138 | 180 | -23.3 |
| 2,000,000-2,499,999 | 5 | 14 | -64.3 | 49 | 92 | -46.7 |
| 2,500,000-2,999,999 | 8 | 14 | -42.9 | 61 | 94 | -35.1 |
| 3,000,000-3,999,999 | 7 | 14 | -50.0 | 75 | 122 | -38.5 |
| 4,000,000-4,999,999 | 4 | 9 | -55.6 | 41 | 69 | -40.6 |
| 5,000,000+ | 4 | 12 | -66.7 | 61 | 87 | -29.9 |
| Totals | 146 | 273 | -46.5 | 1044 | 1701 | -38.6 |
| Number of Active Listings in 84060 and 84098 Zip Codes | ||||||
| This Month | Year to Date | |||||
| 2022 | 2021 | % Chg | 2022 | 2021 | % Chg | |
| 0-199,999 | 0 | 5 | -100.0 | 1 | 18 | -94.4 |
| 200,000-249,999 | 0 | 2 | -100.0 | 2 | 11 | -81.8 |
| 250,000-299,999 | 0 | 3 | -100.0 | 4 | 19 | -78.9 |
| 300,000-399,999 | 6 | 39 | -84.6 | 28 | 131 | -78.6 |
| 400,000-499,999 | 19 | 25 | -24.0 | 83 | 150 | -44.7 |
| 500,000-599,999 | 24 | 23 | 4.3 | 83 | 149 | -44.3 |
| 600,000-699,999 | 27 | 25 | 8.0 | 77 | 139 | -44.6 |
| 700,000-799,999 | 37 | 32 | 15.6 | 94 | 198 | -52.5 |
| 800,000-899,999 | 39 | 29 | 34.5 | 118 | 155 | -23.9 |
| 900,000-999,999 | 43 | 24 | 79.2 | 117 | 135 | -13.3 |
| 1,000,000-1,499,999 | 130 | 81 | 60.5 | 473 | 345 | 37.1 |
| 1,500,000-1,999,999 | 85 | 42 | 102.4 | 273 | 247 | 10.5 |
| 2,000,000-2,499,999 | 51 | 29 | 75.9 | 127 | 128 | -0.8 |
| 2,500,000-2,999,999 | 52 | 21 | 147.6 | 133 | 133 | 0.0 |
| 3,000,000-3,999,999 | 54 | 43 | 25.6 | 155 | 195 | -20.5 |
| 4,000,000-4,999,999 | 35 | 20 | 75.0 | 99 | 105 | -5. |
| 5,000,000+ | 94 | 75 | 25.3 | 217 | 196 | 10.7 |
| Totals | 696 | 518 | 34.4 | 2084 | 2454 | -15.1 |
| New Listings In Park City (Homes and Condos) | ||||||
| This Month | Yea to Date | |||||
| 2022 | 2021 | % Chg | 2022 | 2021 | % Chg | |
| 0-199,999 | 1 | 4 | -75.0 | 1 | 18 | -94.4 |
| 200,000-249,999 | 0 | 1 | -100.0 | 2 | 8 | -75.0 |
| 250,000-299,999 | 1 | 3 | -66.7 | 4 | 16 | -75.0 |
| 30 000-399,999 | 3 | 9 | -66.7 | 20 | 93 | -78.5 |
| 400,000-499,999 | 13 | 31 | -58.1 | 71 | 122 | -41.8 |
| 500,000-599,999 | 15 | 23 | -34.8 | 79 | 121 | -34.7 |
| 600,000-699,999 | 18 | 17 | 5.9 | 70 | 110 | -36.4 |
| 700,000-799,999 | 20 | 27 | -25.9 | 83 | 157 | -47.1 |
| 800,000-899,999 | 32 | 18 | 77.8 | 110 | 118 | -6.8 |
| 900,000-999,999 | 34 | 26 | 0.8 | 105 | 105 | 0.0 |
| 1,000,000-1,499,999 | 105 | 56 | 87.5 | 437 | 272 | 60.7 |
| 1,500,000-1,999,999 | 64 | 31 | 106.5 | 237 | 188 | 26.1 |
| 2,000,000-2,499,999 | 24 | 11 | 118.2 | 103 | 88 | 17.0 |
| 2,500,000-2,999,999 | 22 | 16 | 37.5 | 06 | 98 | 8.2 |
| 3,000,000-3,999,999 | 27 | 27 | 0.0 | 118 | 130 | -9.2 |
| 4,000,000-4,999,9 | 20 | 10 | 100.0 | 76 | 62 | 22.6 |
| 5,000,000+ | 50 | 28 | 78.6 | 163 | 109 | 49.5 |
| Totals | 449 | 338 | 32.8 | 1785 | 1815 | -1.7 |
Park City Real Estate Market Summary for May 2022
For the first time in two and a half years, I'm introducing a new format to review Park City's sales stats each month. While other market reviews view the entire MLS, including the outlying areas, my data review is only about real estate in Park City. The Park City real estate market is small; Therefore, I have combined all residential properties to understand better what's happening in the market. However, we now have information that price bands can evaluate.
The Pending Listings may be tricky because, in 2021, we had several new construction properties under contract that have since closed.
The absorption rate appears to be very close to last year. I've always thrown out averages with Park City real estate statistics, especially since we had the most expensive home to sell in Park City close last month at nearly $ 40 million. The median sale price increased by 11.11%, aligning with appreciation. This year, we are down 30% in new listings, but listings seem like they are coming on at a good clip.
Total Summary: Park City Real Estate Statistics for May 2022
| Summary Statistics for Park City Real Estate in May 2022 | ||||||
| May 2022 | May 2021 | % Chg | 2022 YTD | 2021 YTD | % Chg | |
| Absorption Rate | 1.83 | 1.9 | -3.68 | 1.35 | 2.17 | -37.79 |
| Average List Price | $3,399,965 | $3,042,895 | 11.73 | $2,994,320 | $2,476,407 | 20.91 |
| Median List Price | $1,999,500 | $1,497,250 | 33.54 | $1,785,000 | $1,475,000 | 21.02 |
| Average Sale Price | $2,347,445 | $1,658,371 | 41.55 | $2,165,884 | $2,013,777 | 7.55 |
| Median Sale Price | $1,375,000 | $1,237,500 | 11.11 | $1,495,000 | $1,289,050 | 15.98 |
| Average CDOM | 37 | 48 | -22.92 | 40 | 96 | -58.33 |
| Median CDOM | 6 | 5 | 20.00 | 4 | 15 | -73.33 |
Sold, Pended, Active, and New Listing Charts for May 2022
Below are four charts for sold, pended, active, and new listings. We break down this May 2022 vs. 2021 and the year to date.
| Sold Listings 2022 vs. 2021 | ||||||
| This Month | Year to Date | |||||
| 2022 | 2021 | % Chg | 2022 | 2021 | % Chg | |
| 0-199,999 | 0 | 0 | 0.0 | 1 | 6 | -83.3 |
| 200,000-249,999 | 0 | 3 | -100.0 | 0 | 7 | -100.0 |
| 250,000-299,999 | 0 | 0 | 0.0 | 1 | 7 | -85.7 |
| 300,000-399,999 | 2 | 6 | -66.7 | 17 | 46 | -63.0 |
| 400,000-499,999 | 6 | 9 | -33.3 | 33 | 40 | -17.5 |
| 500,000-599,999 | 5 | 8 | -37.5 | 28 | 31 | -9.7 |
| 600,000-699,999 | 2 | 7 | -71.4 | 17 | 40 | -57.5 |
| 700,000-799,999 | 4 | 0 | N/A | 22 | 37 | -40.5 |
| 800,000-899,999 | 8 | 8 | 0.0 | 33 | 35 | -5.7 |
| 900,000-999,999 | 4 | 6 | -33.3 | 19 | 39 | -51.3 |
| 1,000,000-1,499,999 | 39 | 10 | 290.0 | 136 | 95 | 43.2 |
| 1,500,000-1,999,999 | 23 | 17 | 35.3 | 96 | 78 | 23.1 |
| 2,000,000-2,499,999 | 8 | 7 | 14.3 | 36 | 43 | -16.3 |
| 2,500,000-2,999,999 | 4 | 9 | -55.6 | 42 | 44 | -4.5 |
| 3,000,000-3,999,999 | 6 | 7 | -14.3 | 57 | 69 | -17.4 |
| 4,000,000-4,999,999 | 8 | 7 | 14.3 | 27 | 36 | -25.0 |
| 5,000,000+ | 12 | 2 | 500.0 | 46 | 45 | 2.2 |
| Sold Property Totals | 131 | 106 | 23.6 | 611 | 698 | -12.5 |
| Pending Listings - New Under Contract or In Escrow | ||||||
| This Month | Year to Date | |||||
| 2022 | 2021 | % Chg | 2022 | 2021 | % Chg | |
| 0-199,999 | 0 | 0 | 0.0 | 0 | 5 | -100.0 |
| 200,000-249,999 | 0 | 0 | 0.0 | 1 | 5 | -80.0 |
| 250,000-299,999 | 0 | 3 | -100.0 | 0 | 6 | -100.0 |
| 300,000-399,999 | 1 | 4 | -75.0 | 9 | 37 | -75.7 |
| 400,000-499,999 | 2 | 14 | -85.7 | 20 | 62 | -67.7 |
| 500,000-599,999 | 4 | 5 | -20.0 | 17 | 42 | -59.5 |
| 600,000-699,999 | 0 | 6 | -100.0 | 15 | 33 | -54.5 |
| 700,000-799,999 | 2 | 11 | -81.8 | 15 | 49 | -69.4 |
| 800,000-899,999 | 2 | 6 | -66.7 | 23 | 41 | -43.9 |
| 900,000-999,999 | 3 | 6 | -50.0 | 19 | 40 | -52.5 |
| 1,000,000-1,499,999 | 34 | 22 | 54.5 | 121 | 118 | 2.5 |
| 1,500,000-1,999,999 | 12 | 17 | -29.4 | 53 | 92 | -42.4 |
| 2,000,000-2,499,999 | 3 | 9 | -66.7 | 31 | 56 | -44.6 |
| 2,500,000-2,999,999 | 3 | 9 | -66.7 | 33 | 55 | -40.0 |
| 3,000,000-3,999,999 | 4 | 13 | -69.2 | 46 | 84 | -45.2 |
| 4,000,000-4,999,999 | 6 | 9 | -33.3 | 26 | 51 | -49.0 |
| 5,000,000+ | 6 | 12 | -50.0 | 52 | 63 | -17.5 |
| Pending Totals | 82 | 146 | -43.8 | 481 | 839 | -42.7 |
| Active Listings on the Park City MLS | ||||||
| This Month | Year to Date | |||||
| 2022 | 2021 | % Chg | 2022 | 2021 | % Chg | |
| 0-199,999 | 0 | 0 | 0.0 | 0 | 7 | -100.0 |
| 200,000-249,999 | 0 | 1 | -100.0 | 1 | 6 | -83.3 |
| 250,000-299,999 | 0 | 2 | -100.0 | 0 | 11 | -100.0 |
| 300,000-399,999 | 1 | 36 | -97.2 | 11 | 72 | -84.7 |
| 400,000-499,999 | 12 | 15 | -20.0 | 40 | 85 | -52.9 |
| 500,000-599,999 | 6 | 13 | -53.8 | 27 | 61 | -55.7 |
| 600,000-699,999 | 5 | 13 | -61.5 | 27 | 55 | -50.9 |
| 700,000-799,999 | 13 | 15 | -13.3 | 32 | 69 | -53.6 |
| 800,000-899,999 | 6 | 13 | -53.8 | 34 | 59 | -42.4 |
| 900,000-999,999 | 6 | 13 | -53.8 | 29 | 52 | -44.2 |
| 1,000,000-1,499,999 | 46 | 43 | 7.0 | 173 | 163 | 6.1 |
| 1,500,000-1,999,999 | 28 | 22 | 27.3 | 98 | 123 | -20.3 |
| 2,000,000-2,499,999 | 21 | 13 | 61.5 | 59 | 70 | -15.7 |
| 2,500,000-2,999,999 | 22 | 20 | 10.0 | 64 | 80 | -20.0 |
| 3,000,000-3, 9,999 | 19 | 28 | -32.1 | 81 | 125 | -35.2 |
| 4,000,000-4,999,999 | 12 | 23 | -47.8 | 48 | 84 | -42.9 |
| 5,000,000+ | 49 | 56 | -12.5 | 143 | 133 | 7.5 |
| Active Listings Totals | 246 | 326 | -24.5 | 867 | 1255 | -30.9 |
| New Listings in May 2022 vs. May 2021 | ||||||
| This Month | Year to Date | |||||
| 2022 | 2021 | % Chg | 2022 | 2021 | % Chg | |
| 0-199,999 | 0 | 1 | -100.0 | 0 | 7 | -100.0 |
| 200,000-249,999 | 0 | 0 | 0.0 | 1 | 5 | -80.0 |
| 250,000-299,999 | 0 | 5 | -100.0 | 0 | 10 | -100.0 |
| 300,000-399,999 | 1 | 5 | -80.0 | 8 | 40 | -80.0 |
| 400,000-499,999 | 5 | 13 | -61.5 | 31 | 60 | -48.3 |
| 500,000-599,999 | 10 | 5 | 100.0 | 26 | 50 | -48.0 |
| 600,000-699,999 | 3 | 4 | -25.0 | 21 | 36 | -41.7 |
| 700,000-799,999 | 7 | 16 | -56.2 | 29 | 49 | -40.8 |
| 00,000-899,999 | 5 | 10 | -50.0 | 31 | 46 | -32.6 |
| 900,000-999,999 | 9 | 7 | 28.6 | 28 | 36 | -22.2 |
| 1,000,000-1,499,999 | 43 | 30 | 43.3 | 159 | 130 | 22.3 |
| 1,500,000-1,999,999 | 24 | 20 | 20.0 | 86 | -6.5 | |
| 2,000,000-2,499,999 | 8 | 7 | 14.3 | 48 | 49 | -2.0 |
| 2,500,000-2,999,999 | 14 | 8 | 75.0 | 49 | 58 | -15.5 |
| 3,000,000-3,999,999 | 12 | 11 | 9.1 | 6 | 77 | -14.3 |
| 4,000,000-4,999,999 | 9 | 8 | 12.5 | 30 | 43 | -30.2 |
| 5,000,000+ | 16 | 131.3 | 99 | 72 | 37.5 | |
| New Listing Totals | 187 | 166 | 12.7 | 712 | 860 | -17.2 |
Park City Market Update: April 5, 2022
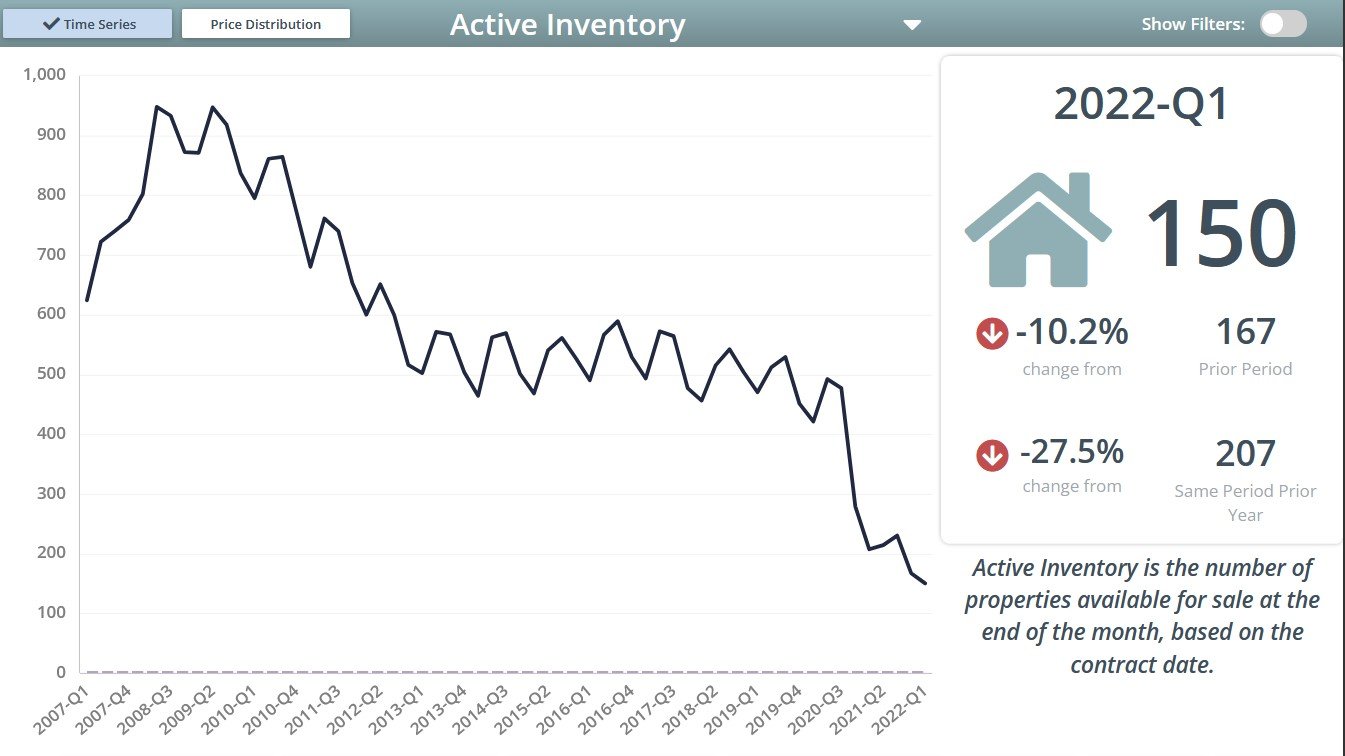 Active inventory is still meager compared to what is expected. For example, in the graph below, for homes for sale in Park City, you can see that we tend to drop to the lowest inventory in the first quarter of every year, and the peak is during the third quarter.
Currently, there are 82 single-family homes for sale on the Park City MLS. Prices range from $1,000,000 for a three-bed, two-bath, 1,874 square foot home to $35,000,000 for a 10,340 square foot home in The Colony at White Pine Canyon.
In March 2022, 34 Park City homes sold in nine days for a median price of $3,173,420 at 101.2% of the asking price. With 86 homes for sale and 59 new listings, there is 2.5 months supply.
Last month, condos in Park City sold for a median price of $1,275,000. The average Park City condo seller received 102.4% of the asking price, and the property sold in six days on average. We currently have one month's worth of condo inventory to sell. Therefore, the condos graph is less cyclical than the single-family homes graph.
Please contact me if you want additional market data or are curious about past sales within a specific community.
Review of Park City Real Estate Trends for March 2022:
We finally have some properties to sell, with new listings up 21% from the month before - the seasonal increase from the chart above. That means we are just 5% down from last year. We now have the second consecutive month of increased inventory, but we're far from the old normal of 1,250 listings on the Park City MLS.
With more listings comes an increase in pended listings. Properties under contract have increased 11% from last month, but the market is still tight, so we're down 39% from the previous year.
Closed Sales dipped 5% from February, but over one hundred closings in Pendry in January and February. Closings are down 23% from March 2021.
The Park City MLS hit a record low for listings in January 2022, with 486 in the area. However, inventory grew in February by 39 properties, and in March, we pulled on 117 new listings for the MLS.
Market Update: March 14, 2022
If you've been following my updates about real estate trends in Park City, you'll notice that we've slowed the pace of updates. This is because the market has been consistently hot with a shallow inventory. However, the past few weeks have made me think that we are starting to slip into a new average pace of buying - somewhere between pre-COVID and the speed of the market in 2021. So don't expect a well-priced property to start on the market for long. Below is a brief look at real estate in Park City for February 2022.
New Listings have seen a nice increase of 29% from the month before, but we're still down 11% from the year earlier. Is it possible that the market is taking a breath for the first time in two years?
Pending Listings are down 17% month-over-month and decreased by 42% year over year. This is misleading because we have had some sizeable new construction developments close and go from Pending to Closed. In addition, as agents, inventory has been so tight that it has restricted sales.
Closed Sales have increased 5% over January and were up 14% from last year.
At the end of January, inventory set a record low, with just 486 residential and land listings available for purchase. However, the list grew by 39 units in February. From 2013 to 2019, PCMLS averaged over 2,100 active listings monthly. In 2020 that average dropped to 1,600. In 2021, the average fell to just 690. 2022 starts with an even more significant decline, averaging just 200 for the first two months.
My take on what we see in the Park City real estate market: This past week, we saw additional Park City & Deer Valley homes and condos hit MLS for sale. In addition, we have started hearing rumblings of interest rate hikes this year, but what's yet to be seen is what it will do to the Park City real estate market. Of course, buyers will return to taking less financing, and interest rates won't fundamentally change our market unless the stock market sees a sizable pull-back.
America has been in some war for nearly 30 years, with 1,000-point swings in the Dow Jones being normal, and pandemics are commonplace for buyers numb to the "noise" that would have scared off buyers a few years back.
I see the Park City real estate market staying strong unless New York and California figure out their tax structure and Florida and Texas cool down in temperature.
However, the urgency has started to relax. Not all buyers feel they must buy today, and we are also starting to see a normal move. For example, sellers that have taken jobs for another company now need to relocate due to being promoted to a new position. (Update Feb 2023 - this guy still hasn't put his house up for sale)
When a buyer asks about future appreciation, I look at Aspen and Jackson Hole, which makes me think there is still plenty of upside for value in Park City, Utah.
April 5, 2022: Park City Real Estate Forecast update:
The topics of interest rate increases, Ukraine, and lack of inventory have buyers asking what will happen to the market and if Park City properties will continue to increase. A crystal ball could be precious to see into the future, but we'll see more buyers move back into cash as mortgage rates increase.
If the stock market and real estate values stay strong nationwide, we won't notice much difference. The United States has been in a war or conflict since the Gulf War in 1990, so I believe the 2022 Russian invasion of Ukraine has had little impact on Park City's real estate values.
New Construction in Park City, Utah
 Newly built homes and condos in Park City have continued to sell in 2021. Currently, there are 720 properties under contract in the Park City area that will build in 2021+. This is up 378 residences compared to last year when I entered 2020+.
From personal experience, that number does not consider several factors, nor does it include custom builds where the buyer purchased the land and hired their builder. Therefore, the increase in new construction is most likely up to the number of units.
New construction in Park City provides slope-side options in Deer Valley, Old Town, and The Canyons Village. In addition, the golf course communities of Tuhaye, Red Ledges, Victory Ranch, and especially Promontory have been selling newly built homes much faster than usual.
New Development Update 12/25/2021:
There will soon be an announcement of a new development in Deer Crest called The Founders Place. In addition, the new golf course community of Wahali also Offers land for sale.
Let me know if you would like to be updated on off-market new construction opportunities. Pendry was delivered in December and January, and one building was left to close. I know of a few off-market opportunities in Tuhaye that are being built will be beautiful homes with enormous views.
View the chart below for home sale information in Park City. You'll see the median, average, and Price Per Square Foot for homes and condos sold in Park City. We like to show both the median and average prices because the luxury properties in Park City can dramatically skew the averages.
Are There Still Good Deals on Park City Homes?
Yes, brokers who don't work daily are mispricing properties in this rapidly changing market. While the home will cost more than last year, there are still good values versus other properties available for sale.
The market is active right now, with buyers in all price ranges. Single-family homes tend to sell quickly, and there could be several offers on a well-priced home; if you're considering making an offer on a property, it's best to be aggressive with the amount of earnest money and timelines we put on the real estate purchase contract. I've been successfully finding off-market properties for buyers and would be happy to assist with your search for off-market properties in Park City, Utah.
If you want to sell your Park City property, please contact me to discuss a private off-market sale.
Market Update: January 2022
When you read the historical market updates below, you'll notice a trend since the lockdowns opened in 2020. In October 2021, I wrote, "The lack of homes and condos for sale in Park City is choking out the market, leading to real estate stats that don't tell the full story." Now, it feels like there is a stranglehold. The market will be fierce for Park City buyers in the spring and summer of 2022.
While some say that the rise of interest rates will slow down the market, it doesn't feel like we have enough inventory to have that happen. With low mortgage rates over the past two years, many of my clients have taken advantage of 3% financing. Three years ago, I worked on 13 consecutive transactions that involved no financing - no banks - and no need for appraisers. When interest rates go up, buyers will lean more into cash when buying a property in Park City. As a result, clients are sitting on more money than ever and trying to place it somewhere tangible.
My clients tend to be high-net-worth individuals who can pay cash if needed. In addition, the buyer demographic is changing; while Park City was once considered a vacation community, it is ending toward a part-time residence community. Utah offers a way to get back to a more peaceful way of life, like the lifestyle when buyers grew up. The golden days of California, New York, and Chicago are gone. Florida is too hot in the summer, so people want to be in Park City for a good portion of the year and enjoy our beautiful summers.
*Editor's Note: Initially featured on our primary Park City Market Trends page, this information has been moved here to enhance loading speed and overall website performance. On 2/8/2024, this blog post was moved to be posted at the end of 2022 to categorize it easily.
Posted by Derrik Carlson on
Leave A Comment